


Why Geospatial Data is the Way Forward in Data Analytics?

Nikhil Hubballi

9 minutes
Data Science
In the last 10 years, Data science and analytics has been the talk of the town everywhere. Data analytics has helped many companies make their decision making faster. Its importance is expected to grow even more in the coming years. But, there’s another aspect of data analytics that’s gaining speed quite rapidly that’s known as ‘Geospatial Data Analytics’.
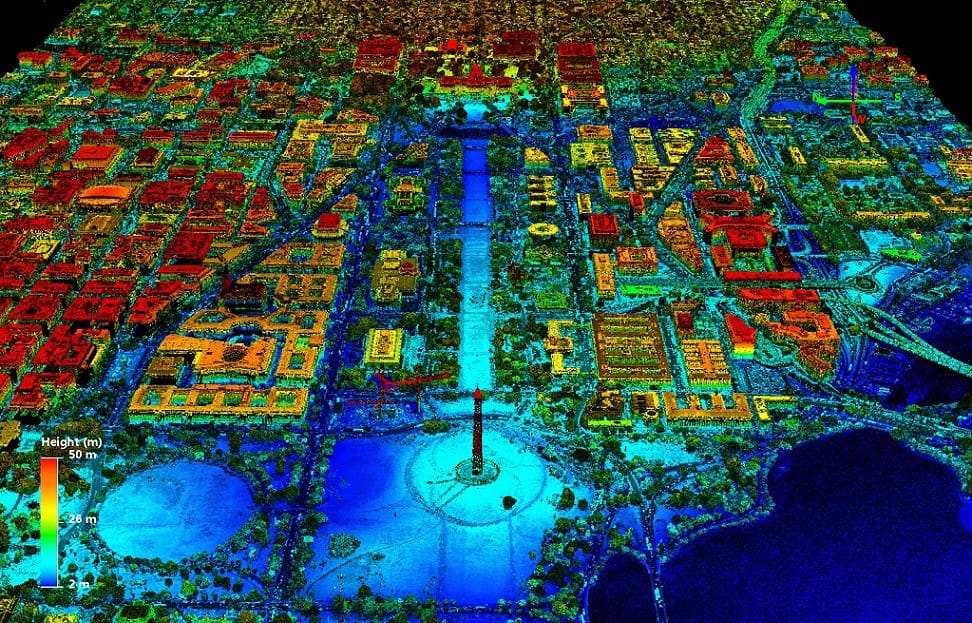
featured image: LIDAR data showing the 3D visual of the US Capitol area, credits – usgs.gov
What’s Geospatial Data?
Any conventional data becomes geospatial data when we add location information or a spatial identifier to it that refers to a position on the earth. It can be a building, lake, river, road, mountain and many other features present on the earth. The most common way to represent any location on the earth while using geospatial data is using a pair of geographic coordinates, latitude and longitude.
However, when you usually share your addresses or location you don’t provide a pair of coordinates. You instead provide a mailing address that constitutes your state, city names, then comes the area, street name and finally the building/house number along with a pin/zip code. Large datasets containing the address in this format becomes difficult to visualize and run analytics. Hence, these addresses are mapped onto geographic coordinates using a process known as ‘Geocoding’. This enables converting any incomplete data with location addresses into proper geospatial data to be further used for geospatial analytics.

How does Geospatial data add value?
Geospatial data can be explored to find spatial trends by recognizing patterns and connections which can be visualized on maps. Providing complete knowledge and insights on the data helps make the decision-making process much faster and more streamlined. At various situations, geospatial data is leveraged to derive customer insights and provide better services to customers to increase their satisfaction. Let’s look at how geospatial data adds value through some real-world examples.
a. Identifying the cause of Cholera outbreak in 1854

One of the earliest examples of using Geospatial data to identify and solve a problem was by a physician known as John Snow. In 1854, when there was a cholera outbreak in Soho, London, a lot of people believed that it was due to pollution and the disease spread through the air. Skeptic about this theory, he set out to investigate the cases himself.
He identified all the houses that were affected on a then city map and found that there was a spatial relationship between the people who were infected and where they lived. He saw the clusters of cases coming out of majorly a single street and concluded that a water pump, likely contaminated, was indeed responsible for the spread of the disease. And, he was able to convince the local council in deciding to disable the water pump.
This was a very important insight and input for the council to identify the source of the problem and take a timely, effective decision.
b. Choosing the best location to set up a brand new store for your product that targets young adults

Many companies and businesses have to rely on data to make well-informed and strategic decisions to increase their sales and services. Often they have to explore how they can reach out to more customers while also serving the existing customers better.
For example, a business decides to set up a brand new store for a new product line-up that targets young adults. Assuming these young adults are either studying higher education degrees or have just started working, the business needs to identify locations of higher importance such as college campuses, start-ups, work locations, malls etc where these people frequent more on a given day. Along with the concentrations of people in a place, accessibility of the location, infrastructure cost by location, different zoning codes by location etc are some of the criteria chosen for the new store.
Based on different criteria chosen, the business can identify the best location that meets all the criteria by assigning some rank to all the locations on their area of interest.
c. Contact tracing in cases of outbreaks and identifying vulnerable hotspots


Unlike the cholera outbreak as explained above, if a disease indeed spreads through the air and human-to-human transmission is possible, it becomes really important to identify each individual from patient zero. We need to create a network of people that have come in contact with each other, where they spent the time since they became infected and how many people were in contact with them etc. So, identifying the movements of the infected person through different locations at different times becomes vital in stopping the spread of the disease.
Geospatial data analytics can be used to identify such infected persons and identify hotspot locations on the map that are more susceptible to a major transmission through a huge number of people. Locations such as temples, subway stations, public gatherings, sports events etc. Identifying such locations and the people that were present at the place and time specified is possible through spatial data.
d. Transportation planning by understanding rider movements.

With the advent of smartphones came a lot of apps that help us do our day-to-day activities. Taking advantage of this handheld device that can access the internet from anywhere and locate using the GPS, many ride-sharing services started in the early 2010s. Uber is one of them. You can request a cab from where you are and go to your destination at the lowest fare possible. To enable the riders’ smooth trip from a source location to the destination from the point you request a cab till you get off from the cab, the company tracks a lot of data.
It may include the time of the request, ETA for the cab to arrive at your pickup point, the latitude, longitude of the pickup location, and also of the drop-off location, the route taken by the cab (lat, long info along the way), how long was the trip, traffic congestion along the route etc. This information is collected for each ride in case of a successful request. Even in the case that you cancel your ride certain information is collected.
The data collected can be useful for the company in understanding where the most number of requests are coming from, what’s the most common destination for the rides, how the number of requests varies throughout the day, what’s the average ETA for the cab after ride confirmation, what’s the request volume coming from a location etc. Each of these questions can help understand the behaviour of their customers, understand where the service is yet to be improved. So that their customers experience using the ride-sharing service can be smooth and fast.
e. Disaster management and mitigation

There’s a major problem that every city across the world faces because of the growing urbanization and global warming. The number of extreme events in the environment has been on the rise. There have been large scale disasters with the likes of stronger hurricanes/cyclones, heavy rainfall causing floods or less rainfall for a long time causing extreme droughts. As a community, the world has to be prepared for what’s to come.
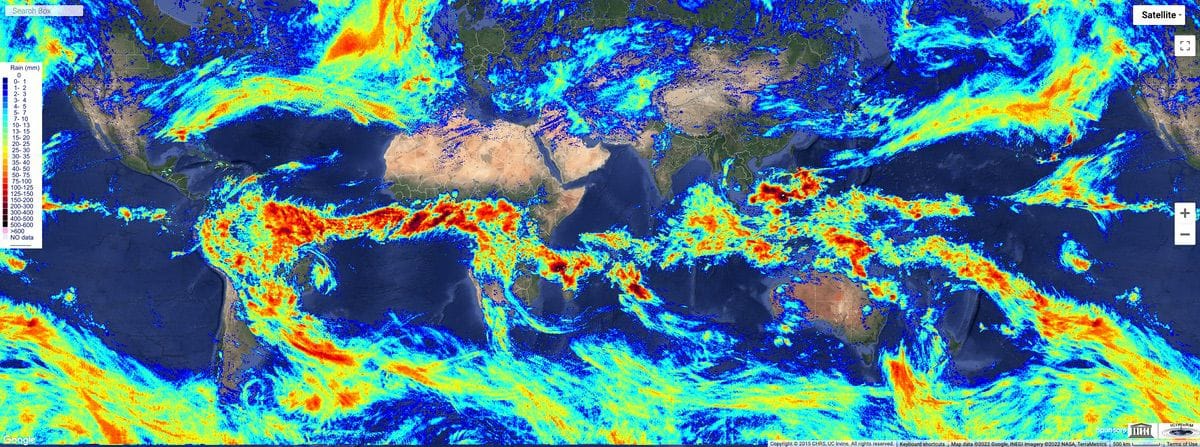
Geospatial data can be instrumental in understanding the effects of global warming and forecasting disaster events before they happen or to use the data to minimize the damage as much as possible. It’s possible to monitor the birth of cyclones on the surface of the sea and its movement towards the land long before it hits the land using satellite imagery. This can be helpful in notifying the people and local council at each city and get them to safety or prepare them for the worst.
In case of a flood due to heavy rainfall, it becomes difficult to monitor the areas affected and understanding the extent of the loss. Real-time satellite imagery can be vital in providing instructions to relief teams to undertake actions to save people and properties.
Why is it gaining speed now?
Geospatial data and analytics have existed for a long time in forms of physical surveys, hard print survey maps for cities’ planning etc. But, since the world has gone digital couple of decades ago and with the advent of smartphones, geospatial data is created at an astonishing speed. These datasets are usually large as well, which makes it harder to process them in large chunks.
There’s a growing requirement for every company/industry in the world to exploit this data to power their growth and provide services to their customers that are unmatched in the industry. Even though it was difficult to process such large amounts of geospatial data in the earlier years, now that we have developed sophisticated GIS software tools, high-speed computer processors and refined machine learning algorithms, Geospatial data can be processed in real-time and deriving the decisive insights has become a piece of cake!
Conclusion
By adding another dimension of location information to the regular data, it’s possible to derive insights that provide new perspective and trends that would not have been possible. These trends and perspectives can be pretty intuitive to arrive at using the strong visualization capabilities of geospatial data. Use of satellite imageries and other geospatial data can help build a resilient society that’s prepared for natural disasters and other extreme events.
Almost every event or a data point collected can have some spatial information to it. With the growth in technologies such as ML, AI the research of spatial analysis and building stronger and effective algorithms is possible today, driving innovations. The geospatial data analytics industry has seen a large growth in market share and is now worth almost $90 billion. It’s only expected to grow furthermore from here. You can also join other data scientists working in the geospatial domain and be part of the next big thing in data analytics!
If you liked this blog, like & subscribe to the blog to get notified about future blog posts. You can find me on LinkedIn, Twitter for any queries or discussions. Check out my previous blog on Why you need to use geopackage files instead of shapefile & geojson here.
Read other related posts: How to use QGIS spatial algorithms with python scripts?, How to geocode addresses for free?

Do you like our stuff? Subscribe now.
Join the Pack!
Liked the content on this page? Get my articles & new insights right in your inbox. Subscribe to join many other readers.

An error has occurred somewhere and it is not possible to submit the form. Please try again later or contact us.
You may also like


An error has occurred somewhere and it is not possible to submit the form. Please try again later or contact us.

PGP Fingerprint
0F91 E5FA E34B 1691 C77E 8CD1 4CD2 C87C 22FE 39B9