


How Alternative Data is Helping the Companies Invest Big?

Nikhil Hubballi

10 minutes

Spatial Analytics
Just a decade back, if a company wanted to bring a new product or service into the market, identifying the potential markets was difficult. Similarly, if the company wanted to track market shifts or optimize their supply chains, it was an exhaustive task for the research team in the company. People had to rely on surveys of sample groups or other forms of offline resources to make their strategic decisions. But today, because of ever-growing data in the world, companies can exploit and reach as many customers as they want to. They can compete with other companies and build huge supply chains expanding even into the smaller cities. It has been possible because of alternative data. And alternative data is helping companies invest big.
featured image: road network showing the city of Berlin.
What's Alternative Data?
Alternative data refers to non-traditional data sources that companies can use apart from their internal data. And, it can provide more accurate, faster and more granular insights to companies regarding their performance and help data-driven business decisions.
This data can come from not one but various non-related data sources. And it may seem like there's no relation between the datasets at all. But using the correct data can help acquire unique insights and give companies a competitive edge over other competitors who don't use alternative data.
Use cases and Value prospects
Demographics
Even today, many companies completely rely on their data to derive insights into their performance, sales, customer reach etc., but what they don't realize is that the data they have is often outdated & limited. And it doesn't help in understanding the behaviour of the people outside the set of their customers.
If any company wants to expand its reach by opening a brand new store at a new location, it's essential to understand the people it's targeting. Let's say a company 'Z' manufactures diapers for children. Even though its end-user is a child, it needs to target the mothers (though both father and mother are equally responsible for the child's needs) to advertise the product and increase its sales. And the company has to have a fair bit of understanding of how many customers they can reach if they start the branch in a particular location.
It can start by getting a residential population distribution, maybe at a city ward level, and then, they can check how many of them are female and in the age group 20-40 (current and potential mothers in the future). If you find an area where the population is high and a high ratio of young female adults, that's a cue to shortlist the area for the potential store location. Of course, there are other factors that the company will need to consider apart from just the customer base. We'll look into that in the coming sections.
So, we have identified 2 major datasets that the company needs but can't have on its own:
- Residential population (at different granular levels - colonies, wards, city etc)
- Age and gender distribution
Just with these datasets, we have helped the company optimize the store location and thus, increased the chances of sales for the company by a large percentage.

Points of Interest
We search for places on Maps all the time. When we want to try out a new restaurant around the corner or across the city, we search for places. If we need to explore tourist attractions in a city, again go to maps and search. Do we need to find a gas station? Search on maps, and we can find it right on your device. All these entities tagged to a geographical location on earth are called Points of Interest (POI). People visit these places every day. These places show a trend in the market, like how certain products are selling at different locations during the day.
An online taxi company can utilize the tourist attractions, shopping malls etc., to get more bookings in a day. Similarly, a hotel can establish its business close to tourist attractions to get more visitors. Let's roll back to company Z. Along with the diapers, it also has a range of other products for baby care and toys. Apart from the residential population, it's also essential to understand the areas where people frequent the most. POIs like parks, playgrounds, nursery schools or pediatric hospitals can help company Z reach more people. So, it would be better for the company to set up a store close to these POIs.
Now, with demography and POI datasets, Z has made a significant gain in understanding the value prospects for setting up a profitable store.

Movement Analytics
In cases of demography and POIs, we were looking for static datasets. Yes, the demography helps in understanding the residential population, and POIs may help identify popular locations. But, understanding how many people are visiting a specific area in a day distributed by the time of the day or how many places a unique visitor did visit in a day on average can help acquire new insights. These insights tell us about human movement patterns and habits.
This data can come from a variety of sources. Telecom networks have cell tower data that collects aggregate numbers of active users in the vicinity of a tower - it can be GPS data as well. Also, ride-sharing companies collect data on point of origin & destination for ride requests. Other services like public transportation, tourism attractions, and shopping malls also collect data on the number of visitors in a day.
Let's take 'Z' again. If it can get the number of visitors to each of the POIs it identified earlier, 'Z' can further shortlist the areas by dropping a few areas and POIs that don't see many visitors. It can also plan the ad campaigns to run in the area to attract people based on the season or time of the day because it knows when people mostly visit those areas and when a peak sale can occur.
We just saw a company Z, that initially had no external/alternative data, use alternative data to its benefit and set up stores in optimal locations.

Individual Data/Online Footprints
It's no secret we leave our digital footprints everywhere we go (websites we open, things we search online etc.,). People tweet, post, comment and review things every day online and the platforms that collect this kind of data anonymously generate insights into people's behaviour. It helps them understand the sentiment, needs, web traffic etc.
For this, let's take the example of an e-commerce company, 'X'. X wants to understand people's behaviour and choices for certain products and create a tailored recommendation for customers in a geographical area by providing more discounts to that group of products. It can look for search data online and understand the product the users are most searching for in an area. Using a tool like SEO keyword analysis, X can look for top-performing products, competing companies and search behaviour.
'X' also wants to understand which individuals are brand conscious and what products are young population interested in buying. The company can use the posts and comments on social media and the reviews written by people on various products and services. It also targets app usage stats to understand the sentiments towards different products.
Different datasets under this category include social/sentiment data, app usage stats, web searches and traffic, and online/offline surveys.
Financial Data
Financial technology (FinTech) companies, in recent years, have increasingly relied on alternative data. Especially with geospatial data, they can drive their decision-making progress. The companies use various data indicators (in some cases as proxy indicators) to understand their customers better and scale their business.
Again, we'll consider this using an example. Let's say Y is a credit risk management company and offers credit loans to individuals. Y needs to understand the risk profiles of its customers so it can estimate and optimize loan amounts to be as low as possible. If there's a greater risk of loan defaults, it usually adjusts the loan limits to cater to the customer.
Payments tech companies like Visa and MasterCard collect data on customer spending worldwide, and this data is geographically tagged. So, one can get insights into spending trends over a geographical area. Few variables give us an understanding of the distribution of high to low-income/affluence people geographically, like;
- Availability of data on property buy/rent rates
- Types of buildings (average apartments/high-rise buildings/villas)
- The average restaurant charges
- The average shopping and sales trend in a specific geographical area.
POI data like parks, basic amenities, health centres etc. can also be helpful to understand the frequent visit locations.
Y can create(estimate) a user persona for any customer living in a specific geographical area based on trends in the area for spending, savings, income/affluence of people in the locality etc. And thus, Y can decide on the feasibility of offering high or low credit limits. It allows them to be cautious while providing riskier credit loans.

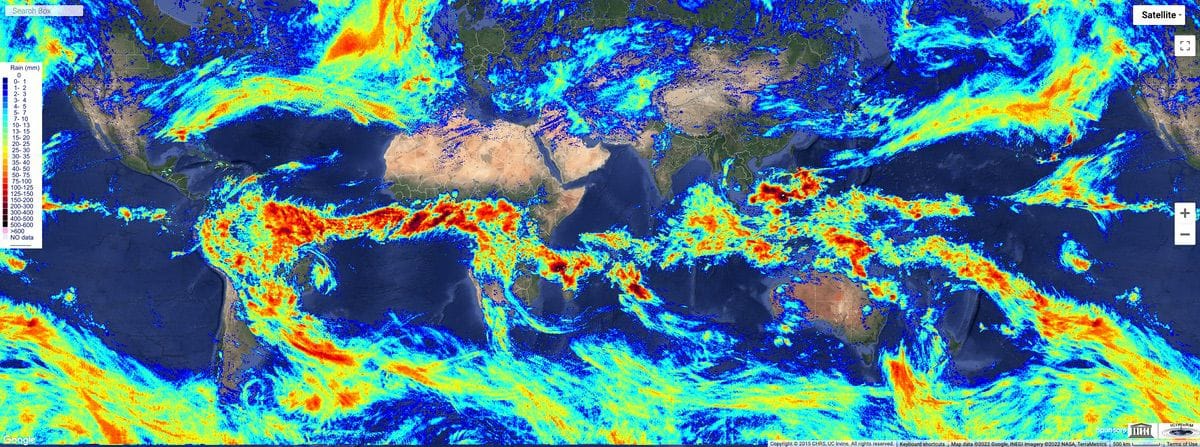
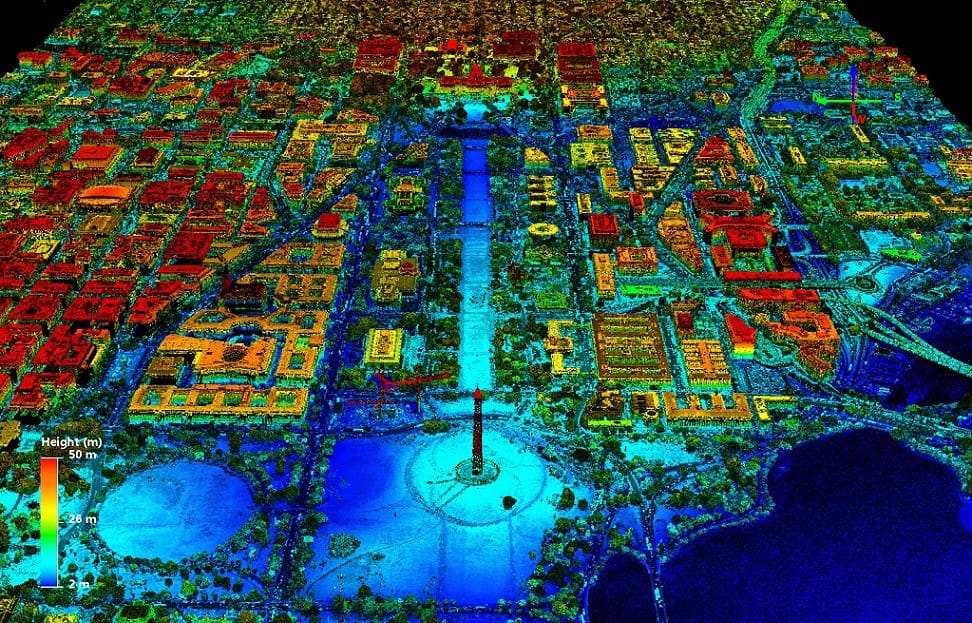
Satellite/Weather Data
Another significant data source that's helping companies gain insights at a very high granular level across the world is satellite data. Companies can use various data from satellites to track agriculture yields, large-scale constructions, monitor pollution levels etc.
Here let's consider an insurance company C that offers insurance policies to properties. Similar to the credit risk profile, C needs to create a risk profile for the properties. And for any property, there are several questions to be answered;
- Where is the building situated?
- Is it an earthquake-prone area?
- Are there frequent floods or storms affecting the locality?
- What's the kind of soil the property is built on?
- Is the soil strong enough to hold the foundation?
And many others that the company needs to understand before offering the policy.
Satellite Imagery offers data for the weather forecast, flood-plains and storm-surge-prone areas and soil type through direct observations and derived products. Thus along with the C's internal data, it can leverage satellite data to build a risk profile for the property. And it can use this to offer adjusted insurance policies according to the risks associated with the property.

Conclusion
Alternative/external data is invaluable. Because it generates insights and helps data-driven decisions for any company using it. Companies want to reach more customers and be profitable. And, alternative data has given way forward to this by creating more efficient ways to provide insights & drive decisions.
And as I mentioned earlier, the datasets that we thought to have no relations at all - when used in combination can offer surprisingly fascinating insights that can help companies scale their businesses to new heights.
If you liked the blog, subscribe to the blog now and get notified about future blog posts. Comment below if you have any questions or suggestions. Find me on LinkedIn, Twitter for any queries or discussions. Check out my previous blog on Why Geospatial Data is the way forward in data analytics here.

Do you like our stuff? Subscribe now.
Join the Pack!
Liked the content on this page? Get my articles & new insights right in your inbox. Subscribe to join many other readers.

An error has occurred somewhere and it is not possible to submit the form. Please try again later or contact us.
You may also like


.jpg)

An error has occurred somewhere and it is not possible to submit the form. Please try again later or contact us.

PGP Fingerprint
0F91 E5FA E34B 1691 C77E 8CD1 4CD2 C87C 22FE 39B9